3.1.7:Debugger FAQ
1 MDK autorun not working
After the program is downloaded and found not running, the following points need to be noted:
- Check that the reset mode in the Debugger settings is correct.
- Reset and run is checked or unchecked.
- Is the Flash Algorithm setting correct.
2 Breakpoints do not take effect
Please check the compilation settings. Such as optimization level, debugger settings, and its own code features such as whether watchdog is enabled.
3 Limit the number of breakpoints
The number of hardware breakpoints is related to the chip itself and depends on the MCU core version unit, the manual will list the number of breakpoints supported by the current chip, please check the manual of the chip you are using for the contents of the debugging chapter.
4 Bootloader deleted during download
- For IROM setup, it is important to make sure that the generated Image address is correct.
- When writing to Flash, pay attention to the selection, page erase, set in the Debugger page, so that you can avoid the whole chip erase, retaining the other data inside the chip.
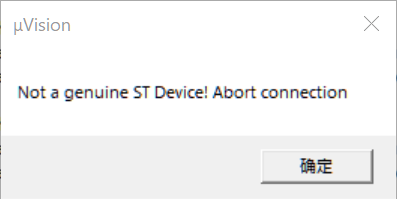
5 Prompt for device mismatch
Tip Message: Connection refused due to device mismatch!(Not a genuine ST Device! Abort connection)
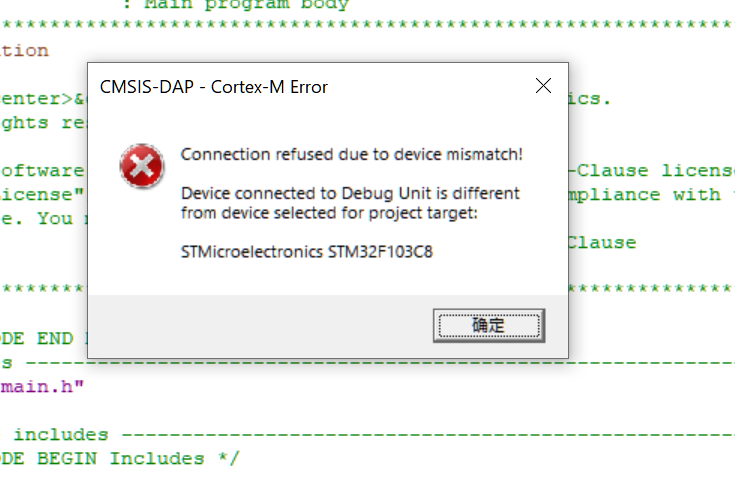
Maybe the purchased chip is not the original chip, such as polished silkscreen, or business false advertising, due to some of the popular chips many manufacturers have similar chips, and even PIN TO PIN compatible, so there are these problems, the low version of the MDK and the chip support packages will not check the chip's IDCODE, so there may not be an error report, replace with a higher version of the MDK and the support packages, there may be an error report! If you change to a higher version of the MDK and support package, you may get an error. You can check the IDCODE of the chip manual to determine the real chip model.
For example, the IDCODE of the STM32F1 chip is: 0x1B10417.

But the sample is: 0x2BA01477 as shown below:
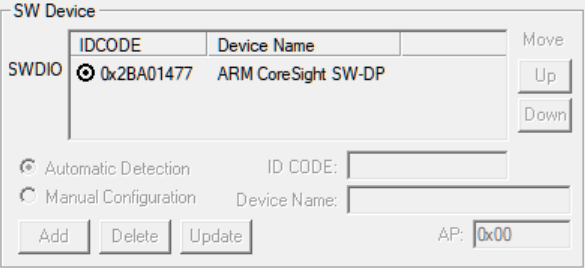
After identifying, this chip may be: CS32F103C8T6 (CKS32F103C8T6).
5.1 Solution 1
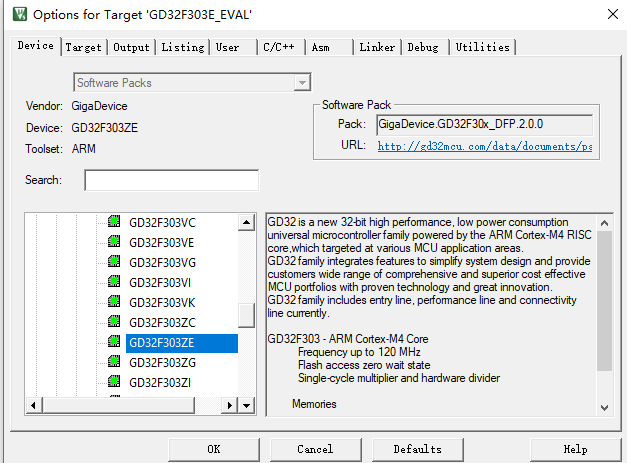
According to IDCODE, you can find the real model number of the chip, download the backup package of the corresponding manufacturer's chip, install it, switch it to the actual chip model, and then debug it.
5.1 Solution 2
First find the pack of the selected chip, and find the pdsc file of the current chip, such as C:\Keil_v5.25\ARM\PACK\Keil\STM32F1xx_DFP\2.3.0\Keil.STM32F1xx_DFP.pdsc
<sequence name="CheckID">
        <block>
          __var pidr1 = 0;
          __var pidr2 = 0;
          __var jep106id = 0;
          __var ROMTableBase = 0;

          __ap = 0;      // AHB-AP

          ROMTableBase = ReadAP(0xF8) & ~0x3;

          pidr1 = Read32(ROMTableBase + 0x0FE4);
          pidr2 = Read32(ROMTableBase + 0x0FE8);
          jep106id = ((pidr2 & 0x7) << 4 ) | ((pidr1 >> 4) & 0xF);
        </block>

        //Comment out the chip ID to check the configuration
        //<control if="jep106id != 0x20">
        //  <block>
        //          Query(0, "Not a genuine ST Device! Abort connection", 1);
        //          Message(2, "Not a genuine ST Device! Abort connection.");
        //  </block>
        //</control>
</sequence>
- The PowerWriter® team does not trace back to the actual chip model, and the above chip IDCODE is only illustrative of actual cases, as noted.
- The pdsc file is just an example, the paths and settings may be different for different versions of packages.
6 Unable to recognize debugger
Error Code: No Debug Unit Device found.
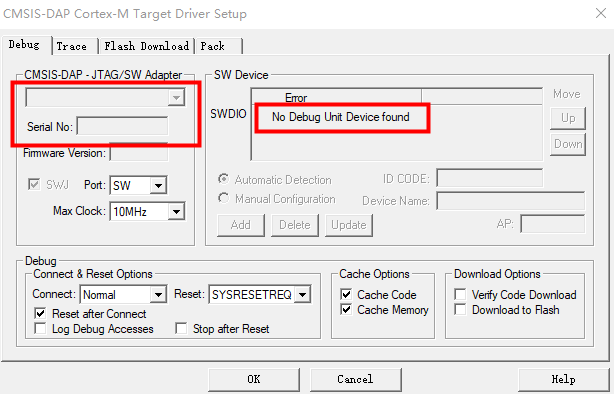
Handling method: Reconnect the programmer, make sure the programmer is connected properly and the driver is connected properly, refer to Driver Installation and Cleanup。
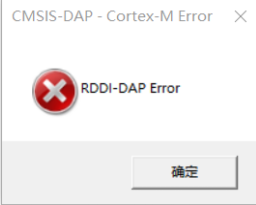
7 RDDI-DAP Error
Error message: SWD/JTAG Communication Failure(RDDI-DAP Error)、RDDI-DAP Error。
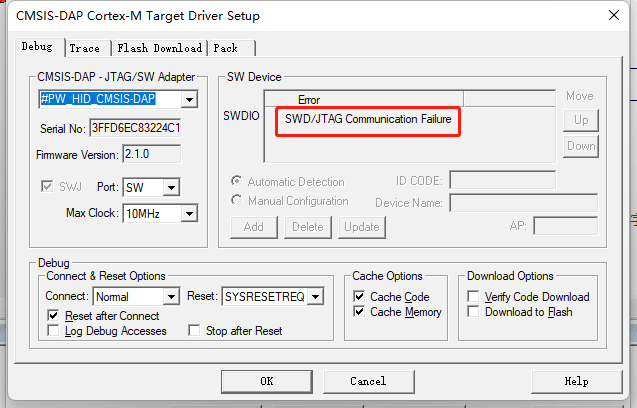
Solution:
Make sure the programmer and the chip programmer port are connected properly, the chip does not have advanced protection turned on or the programmer port is multiplexed, please check the specific treatment:
How to deal with a chip that is not connected
8 Programming Failure
Error message: Flash Timeout. Reset the Target and try it again.


Solution:
Ensure that the chip does not have read protection and write protection turned on, remove the protection method reference:De-read protection。
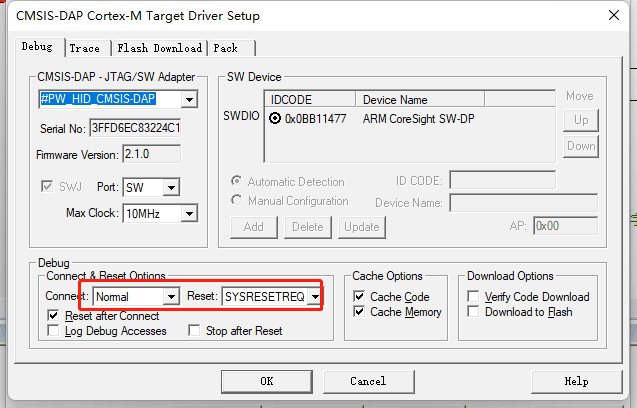
When the program runs on the fly or the chip reset is not successful, it will lead to unsuccessful programming, please reconnect the chip and make sure that the debugger setting options are as shown in the following figure, and you can try to pull the boot0 pin high before debugging.
Change the debug clock size.
Use the PowerWriter® client to erase the target chip.
9 Verify failure
Error message: Contents mismatch
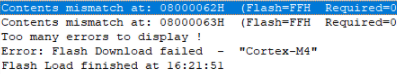
Troubleshooting: Make sure the flash algorithm parameters are normal, or you can re-select the chip model to update the flash algorithm settings.

10 Unable to load flash Algorithm
Error Code: Cannot Load Flash Programming Algorithm
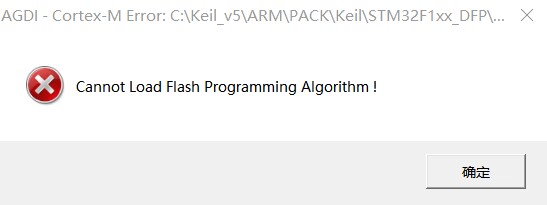
Reselecting the Flash Algorithm
11 Repeat add flash algorithm
Error Code: Overlapping of Algorithms at Address 08000000H
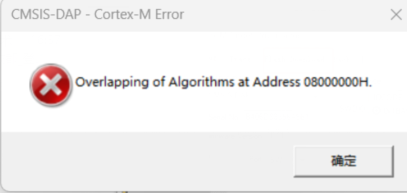
Check Flash Algorithm Settings.
12 Disconnection during debugging
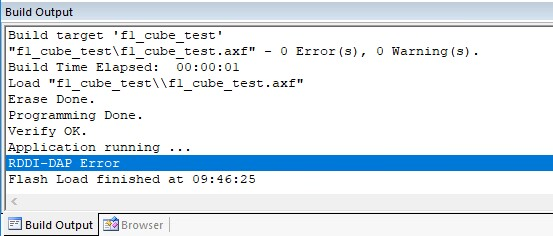
As shown in the above figure, MDK erase, write, and checksum all pass, but after the Application running ... However, after the Application running ..., RDDI-DAP Error occurs!
Reason: The debugging function of IO is not turned on in the program, for example, the debugging function is off by default in Cube MX, if you generate the code directly to debug, this problem will occur.
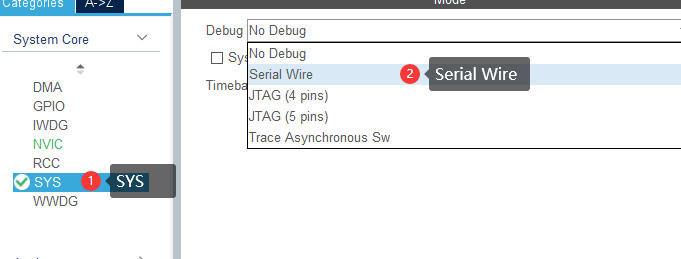
Solution: In Cube MX, on the left side, open Serial Wire in SYS->Debug as shown below, and then update the code.
If directly in code, adjust the debug mode.
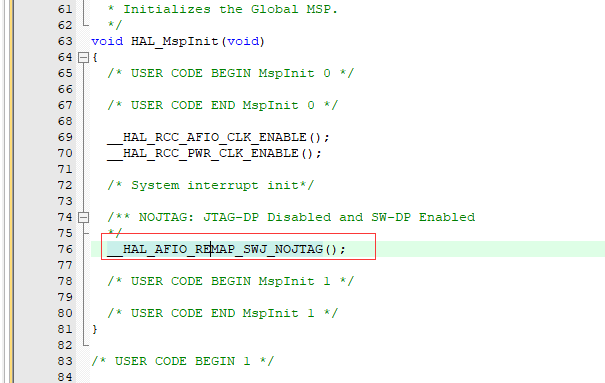
Other brands and tools are handled similarly, and such problems are caused by the debug pins not being configured in debug mode.
13 MDK cannot recognize the chip
The reason for this phenomenon is the same as the previous one, because there is code running in the chip, the debugging port is disabled, and the efficiency of the PowerWriter® response is faster than the debugger, so there is a situation where the PowerWriter® can recognize it, but the MDK fails.
Treatment:
After connecting to the target chip using the PowerWriter®, perform the following to erase all data.
- Option byte, restore the defaults, and then write.
- Erase Program Memory Program space data.
After performing the above operations, go to the MDK to debug.
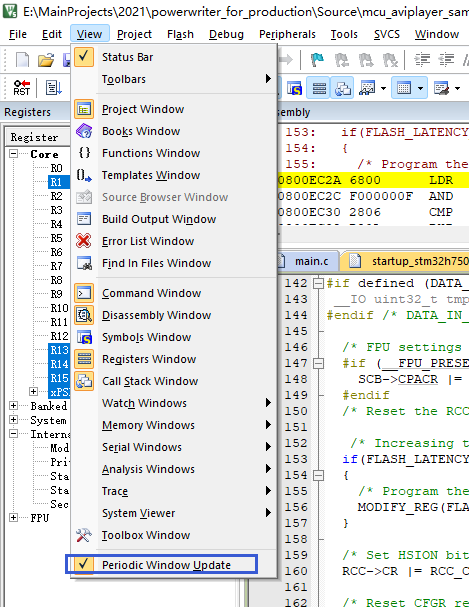
14 Watch variable not refreshed (grayed out)
The data is not refreshed because Periodic Window Update is not checked. After entering the debugging state, check this function from View -> Periodic Window Update in the menu, the debugger and the data in the Watch window will be refreshed in real time, as shown in the following figure:
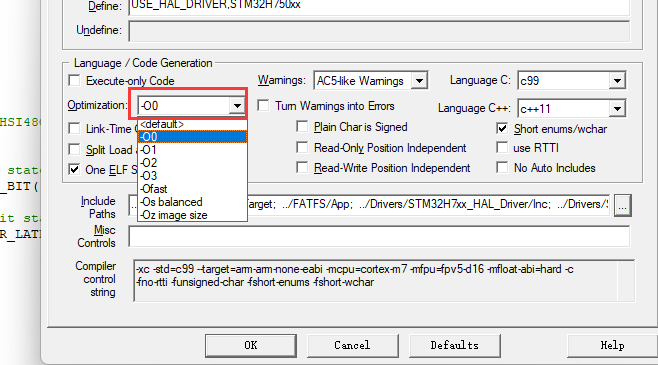
The reason for the grey is that the compiler optimization level is too high, resulting in the actual generation of debugging information and source code breakpoints are not completely consistent with the location of the synchronization problem, at this time you can adjust the optimization level of the entire project, such as to change to the level of 0 no optimization, the location of the source code breakpoints and access to the actual variables are completely consistent with the following chart:
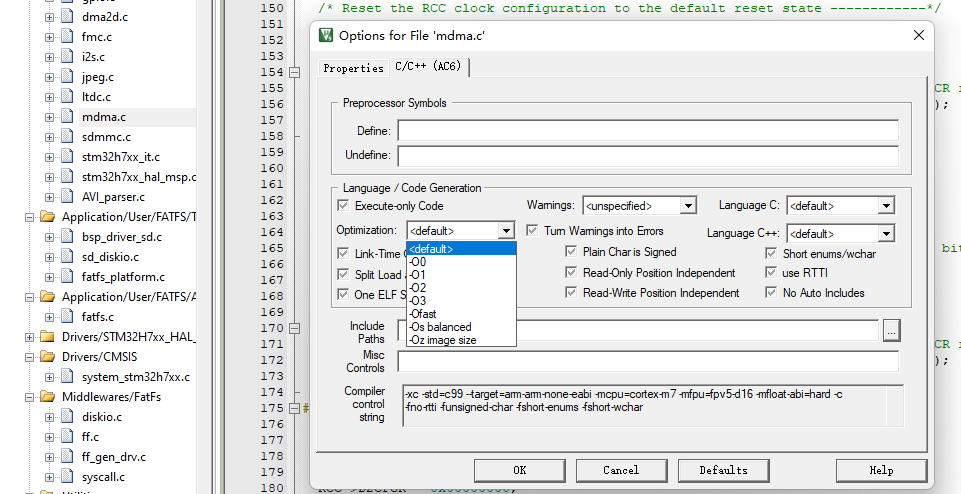
In addition, you can adjust the optimization level of part of the source code individually by right clicking the source code file (.c, .cpp) in MDK to open the file properties and set the optimization level of the file individually, as shown in the following figure:
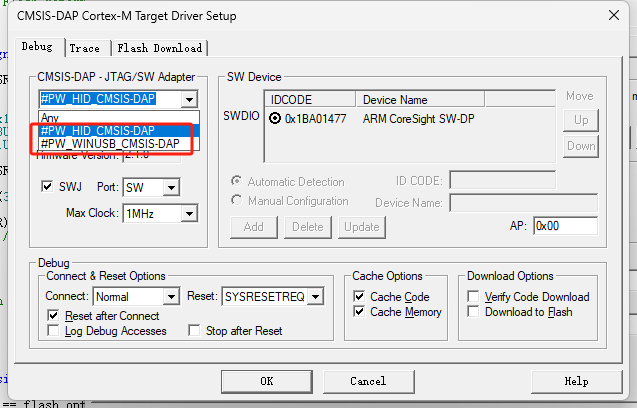
15 Can't recognize winusb mode
In the debugger selection screen, you can see the dual-mode debugging equipment:
HID channel, standard mode.
WINUSB mode, high speed mode.
As shown below, high-speed mode is recommended.
If the WINUSB mode is not visible in the debugger selection interface, there may be two possible scenarios:
If the Keil version is 5.28 or earlier, Keil itself does not support WINUSB.
If the Keil version is later than 5.28, but only the PowerDebugger device does not display the WINUSB mode.
According to the official ARM solution, for early versions of Keil V5,replace the CMSIS_DA.dll file in the Keil installation directory Keil_v5\ARM\BIN with the one provided on the ARM websiteDocumentation – Arm DeveloperThis will enable recognition of WinUSB.
Both of the above situations can be resolved by replacing the CMSIS_DA.dll file.
If the device is not recognized , try updating the driver,See Drive installation,If it can be used normally, no installation is required!