4.3 RTT Scope
4.3.1 Feature list
The Power Debugger integrates full RTT Viewer functionality (channel 0) and supports the following features and functions
- Support for RTT j-scope channels, see details UM08028 J-Scope - SEGGER Wiki。
- Supports adding custom variable monitoring.
- Support graphics X axis, Y axis waveform adaptive, automatic scrolling, scaling, drag operations.
- Support to view any sampled frame data.
- Data export (csv format) is supported.
- Support rising edge, falling edge, bidirectional edge trigger control.
- Support target chip reset, pause (resume) operation.
- Support sampling rate, buffer usage view.
- Supports SWD/JTAG dual-protocol interfaces.
- Supports up to 60Mhz clock speed.
- Support RTT Scope and RTT Viewer to work simultaneously.
- Supports float, bool, uin8_t, in8_t, uin16_t, in16_t, uin32_t, and in32_t Mainstream types.
- Waveform color Settings are supported.
- Supports monitoring object enabling Settings.
- Support the maximum value, minimum value, average value, current value and so on.
If you work in LAN or public network mode, the output speed may be slow. Therefore, avoid large data and low latency terminal output.
4.3.1 RTT Scope screen
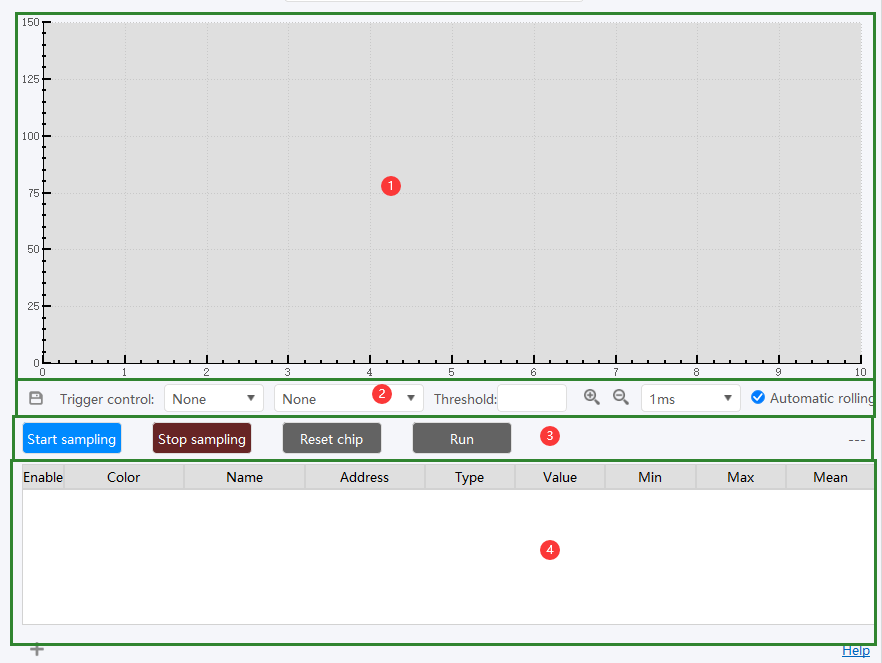
The main functions of RTT Scope include:
- Waveform display area
- Data storage, trigger Settings, waveform control.
- Function button, real-time status.
- Monitor variable area.
It consists of four parts, as shown in the figure below:
4.3.2 RTT Scope waveform display
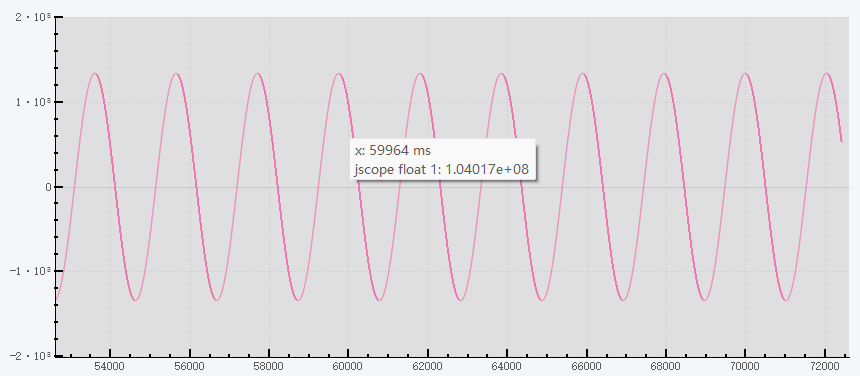
The drawing area is displayed as follows, real-time display of the monitored waveform, as well as the time stamp of the X axis, the value of the Y axis and other information.
4.3.2.1 Zoom and scroll on the X-axis
Available by clicking![]() Zoom in , Zoom out Icon to zoom in and out of the waveform,you can also select a time value for a square directly from the drop-down list,checked
Zoom in , Zoom out Icon to zoom in and out of the waveform,you can also select a time value for a square directly from the drop-down list,checked ![]() option automatically refreshes the read data frame information。
option automatically refreshes the read data frame information。
Drag and drop the left mouse button to view the waveform at any sampling point.
4.3.2.2 Zoom and scroll on the Y-axis
Cancel Auto scrolling and scroll the mouse wheel to zoom in or out the Y axis. Hold down the left mouse button and drag to move the visible range of the Y axis vertically.
Ratcheting Auto scroll will adapt to the visible range of the Y-axis.
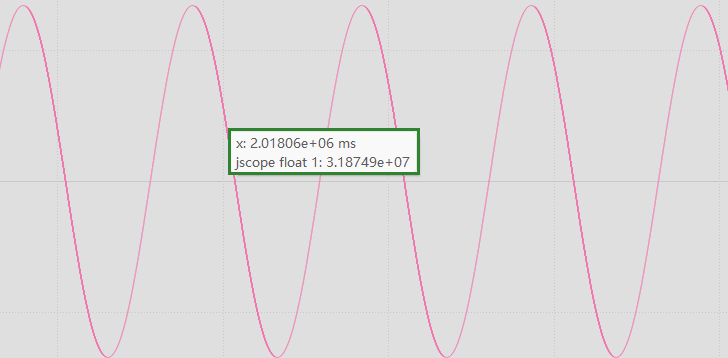
4.3.2.3 Any sample frame information
You can view the sampling information of a frame by hovering the mouse, as shown in the following figure.
4.3.3 Data export
This can be done by clicking the Save button![]() export all current sample data,the data format is csv,you can use office excel to view the data in the following format.
export all current sample data,the data format is csv,you can use office excel to view the data in the following format.
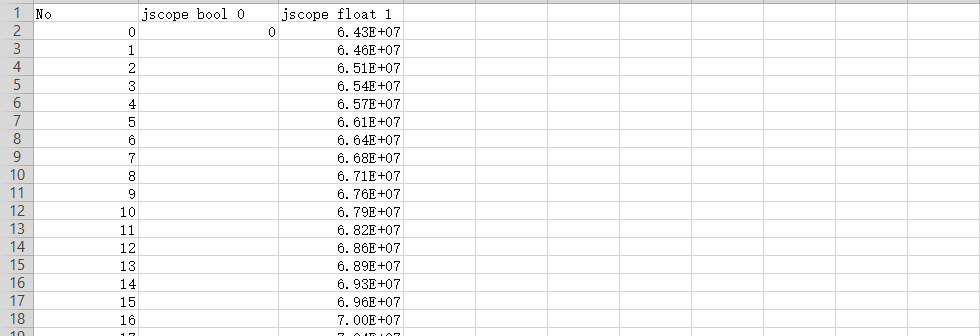
The legend is a test sample. The icon format of exported data depends on the actual situation.
4.3.4 Trigger
![]()
You can set the trigger to capture key data frames. The data drop before it is triggered will not refresh the display. For details, see the following process
- Set trigger mode : rising edge, falling edge, bidirectional edge.
- Trigger monitoring object: Select the trigger monitoring object.
- Set trigger Range : Set the trigger threshold of the monitored object.
- Start monitoring
4.3.5 Real-time state
![]()
The real-time status displays the current sampling rate information and buffer usage.
The buffer is set to 32 MB bytes. When the buffer is full, the current sampled data will be overwritten. If data storage is required, save it in time.
4.3.6 Start sampling
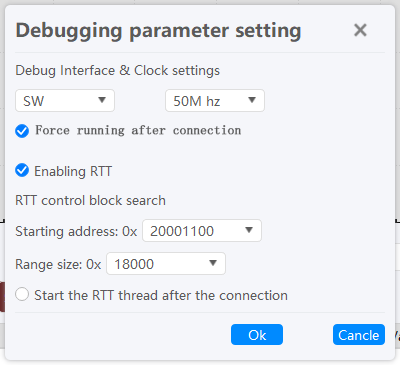
- Debugging port: Can select SW, JTAG communication protocol.
- Clock: Can be set up to 60Mhz.
- Forced Run after connection : After connecting to the target chip, the operation of the target chip is resumed.
- Enabling RTT : Enable the monitoring of the j-scope_xxx channel in the RTT channel when Scope is enabled.
- Start Address : Set the start address of RTT.
- Range Size : Set the search range size of RTT.
- Start the RTT thread after the connection: The RTT Viewer function will be synchronously enabled after the connection is successful.
4.3.7 Stop sampling
Click Stop sampling to stop data collection.
Stop sampling will stop the sampling of the RTT Viewer simultaneously (If the RTT thread is started after connection selection).
4.3.8 Reset chip
Reset the target chip.
4.3.9 Pause (Resume)
Pause or resume the running of the target chip.
4.3.10 User-defined monitoring objects
Power debugger's RTT Scope feature,at the same time, it supports the monitoring of custom objects (variables). This function can realize the real-time Scope function without adding the software support package of RTT. The object property panel is shown as follows:

- Enable: Enables or disables the monitoring of the current object.
- Color: Object waveform display color.
- Name: Name of the object.
- Address: Address of the monitoring object in the SRAM (view it through the map file, elf file is not supported for now).
- Type: Type of the monitored object, which can be float, uint8_t, int8_t, uint16_t, int16_t, uint32_t, int32_t.
- Value: Current value.
- Min: Minimum value of the monitored object.
- Max: Maximum value of the monitored object.
- Average: Average value of the monitored object.
4.3.10.1 Add object
Click the Add Object button![]() ,pop-up add object property setting box, as shown below, according to the interface content, set variable name, waveform color, whether to enable after adding, variable address and variable type, and then click OK button, as shown below:
,pop-up add object property setting box, as shown below, according to the interface content, set variable name, waveform color, whether to enable after adding, variable address and variable type, and then click OK button, as shown below:

- The address of the monitored object can be viewed by viewing the generated compiler output information such as map and list, or obtained by analyzing elf files, or fixed to the specified address.
- Waveform color provides a default color setting template. If you are not satisfied with the default color template, you can adjust the template color value.
4.3.10.2 Modify object
Double-click the object property list, in the pop-up window you can modify the object name, waveform color, address, and type settings.
The RTT j-scope channel supports only attribute viewing.
4.3.10.3 Delete object
Double-click the object property list and click the Delete button in the pop-up window to delete the monitoring object.
User-defined objects can be deleted. Built-in RTT objects cannot be deleted (the function can be disabled).
4.3.11 Export and import configuration
![]() Click the Import and Export button to import and export the Settings of the user-defined object.
Click the Import and Export button to import and export the Settings of the user-defined object.