3.3 RTT Scope
3.3.1 Ready for use
SEGGER_RTT_V766b.zip download (optional)
3.3.2 Start sampling
The following figure shows the process for enabling RTT jscope monitoring:
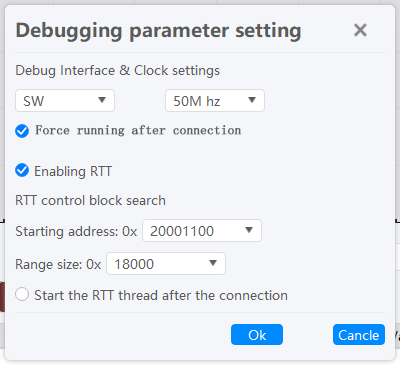
- Click the Start sample button.
- Configure working parameters between the target chip and the Power Debugger: interface type, clock speed, and RTT control block search configuration (Optional ).
- Click the OK button.
- Wait for RTT initialization to complete.
After initialization is complete, you will see the following j-scope monitoring channel, as follows:

At the same time, you will see j-scope's output test positive wave information as follows:
3.3.2 Add any object monitor
3.3.2.1 Get object information
By compiling demo, view the map file information and find the structure. Similar information is shown below. The address of m_VarScope is 0x200011c8, as shown below:
#pragma pack(push,1)
typedef struct S_WatchScope{
    float           f32;        //offset:   0
    int32_t         i32;        //offset:   4
    uint32_t        u32;        //offset:   8
    uint16_t        u16;        //offset:   12
    int16_t         i16;        //offset:   14
    int8_t          i8;         //offset:   16
    uint8_t         u8;         //offset:   17
    bool            b8;         //offset:   18
}S_WatchScope;
#pragma pack(pop)

volatile S_RTTScope         m_RTTScope;
View the corresponding information in the map, and the corresponding address can be found as follows:
m_VarScope 0x200011c8 Data 19 main.o(.bss)
3.3.2.2 Add monitoring
Click the Add Object button![]() ,The dialog box for adding object properties is displayed,as shown below, according to the interface content, set variable name, waveform color, whether to enable after adding, variable address and variable type, and then click OK button, as shown below:
,The dialog box for adding object properties is displayed,as shown below, according to the interface content, set variable name, waveform color, whether to enable after adding, variable address and variable type, and then click OK button, as shown below:
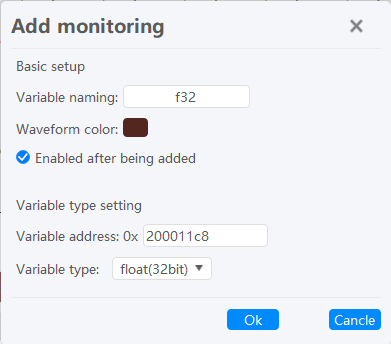
Next, add all the structure members that you want to monitor in the lower left corner of the RTT Scope, and when the final addition is complete, look like this:

Before adding a custom monitor, stop sampling.
3.3.2.3 Start sampling
Select the object you want to monitor and then start sampling to see the output, as shown below.
3.3.4 Stop sampling
Click the 【 Stop sampling 】 button to stop.
3.3.5 Reset & Run state
You can reset the target chip and switch between Run and Halt states by clicking the "Reset chip " and "Run (Pause) " buttons.
3.3.6 Reference
For more information please refer to Reference -RTT Scope