3.1.1 Debugger Tutorial
For a more detailed tutorial on the debugger see Debugger Full Tutorial .
PowerWriter® has built-in Cortex-M Debugger function to support mainstream general-purpose MCUs, and keep constant upgrading and maintenance, this section introduces the specific use of the debugger.
3.1.1 Prepare
The Power Writer ARM Debugger is based on the DAP debugging interface and supports all brands of chips adapted by Power Writer, with integrated ITM Trace and a maximum clock speed of 20Mhz:
- Power Writer integrated Debugger for drive-free (HID devices), but in some systems, there may be occasional driver abnormalities, in the device manager to check whether the Power Writer driver is normal, such as driver abnormalities, please refer to the Driver FAQ, conduct a row.
- Power Writer in Debugger mode, you can not disconnect the PowerWriter®, PowerWriter® will automatically switch in the Debugger form or Writer form, in Debugger mode, PowerWriter® in the additional provision of the serial port assistant, at this time you can be used as logging, command input port, or use the Trace function, in the MDK virtual serial port 1 input and output commands, about this part of the function, please refer to the MDK documentation. In Debugger mode, PowerWriter® provides a serial port helper, which can be used as a logging port, a command input port, or a Trace function, which can input and output commands in the virtual serial port 1 of MDK, please refer to the official document of MDK for more information about this part of the function: CMSIS-DAP Debugger User's Guide: About CMSIS-DAP (keil.com).
3.1.2 PowerWriter® For MDK
This section describes how the PowerWriter® Debugger is used in MDK.
3.1.2.1 PowerWriter® For MDK
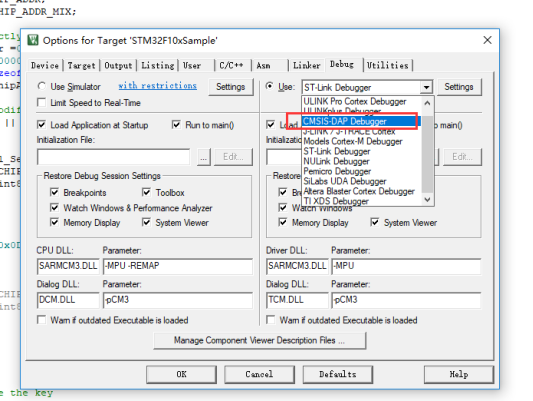
After connecting the target board, select CMSIS-DAP Debugger as the debugger in the Debugger Selection page as shown below:
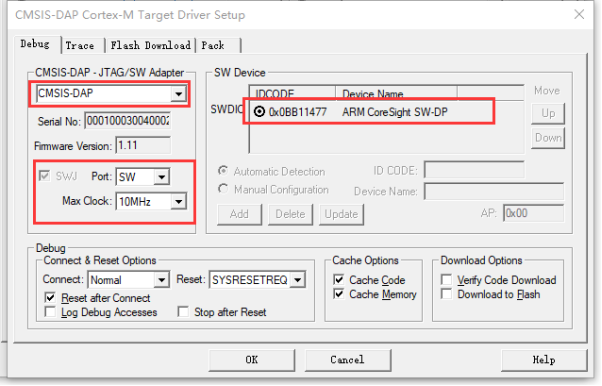
Next, click the Setup Page button to enter the Debugger's setup page, as shown in the figure, select the CMSIS-DAP that has been connected from the list on the left side, select Port as SW mode, select CLOCK, the highest you can select is 10M, and the rest keep the default.
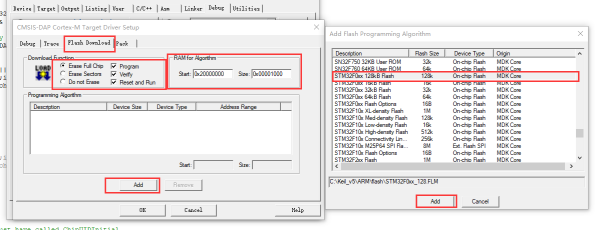
The last step is to add the Flash Algorithm required by the Debugger, click on the Flash Download tab to go to the Download Configuration page, click on the ADD button to select the Flash Algorithm of the corresponding chip from the list, as shown in the figure:
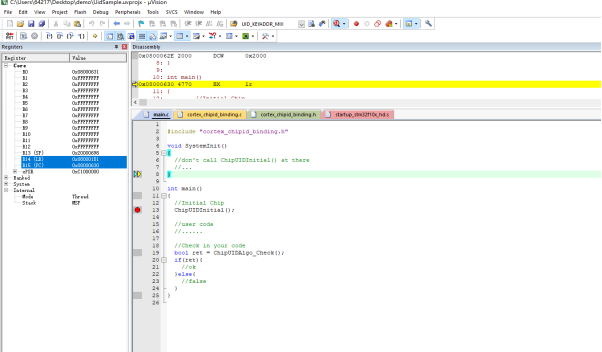
Once the Flash Algorithm has been added, click OK to close the window and go back to the main MDK page and click on the toolbar's button or the keyboard's CTRL + F5 can enter Debug mode, as shown in the figure, after entering the debugging function, the Power Writer's Debug function is the same as that of STLINK, NULINK, GDLINK and J-LINK.
If you cannot see the target chip ID in the debugger setup page, or if it indicates an error, please refer to the Debugger FAQ Perform problem troubleshooting to ensure that the target chip can be detected properly.
Other IDE applications are basically the same as MDK, such as CUBEIDE, IAR and other IDE tools.
If you cannot find the Algorithm entry for the specified chip in Flash Algorithm, you need to install the corresponding DFP package for the chip, which can be downloaded in the following ways:
- Use the pack installer that comes with MDK:
,
- Download from the MDK Device Adaptor Kit site: MDK5 Software Packs (keil.com)
- Obtain the DFP package from the chip manufacturer's official channel
- Use the pack installer that comes with MDK:
Some older chip model DFP packages may no longer be updated and maintained and can be downloaded from the MDK v4 Legacy Support (keil.com)
3.1.2.2 PowerWriter® for MDK Trace
In addition to the debugger, Power Writer's integrated Debugger also integrates the ITM Trace function, which can be used in place of the serial port and other tools, and when used in conjunction with the MDK, will exceed the utility of the serial port. The Power Writer tutorial video has a complete description of how to use the Power Writer Debugger ITM Trace function. In the Power Writer tutorial video, there is a complete description of how to use the Power Writer Debugger ITM Trace function, but this section only introduces the overview function. The cores that support the ITM Trace function are shown in Table 4.1.1.3:
| Kernel version | Whether ITM is supported |
|---|---|
| cm3、cm33 | Support for ITM Trace |
| cm35+ | |
| cm4 | |
| cm55 | |
| cm7 | |
| armv8mml | |
| armv81mml | |
| sc300 | |
| Cm0 | No support for ITM Trace |
| Cm0+ | |
| Cm1 | |
| Cm23 | |
| Armv7 | |
| Armv8 | |
| Armv8mbl | |
| Sc000 | |
| ... | For other kernels, please refer to the official documentation. |
Query whether the current chip supports ITM: It can be queried through the current user manual as shown below:
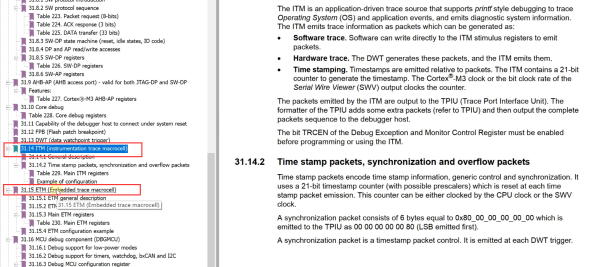
How to turn on ITM: In the Trace Settings page of the Debugger Settings page, turn it on and set the relevant parameters as shown in the following figure:
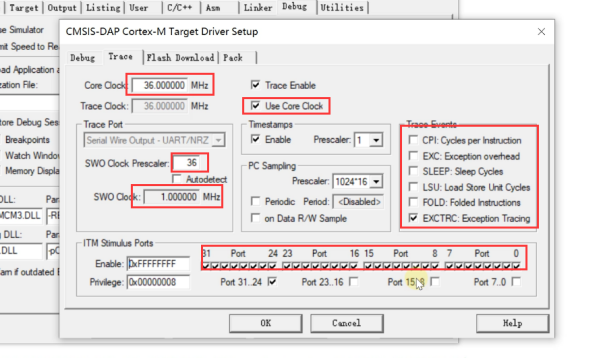
Trace function setting page:
- Core Clock: Fill in the actual clock of the chip.
- Trace Enable: Enables the Trace function.
- Use Core Clock: Use the core clock.
- Clock Pressler : The referral is set to coincide with the kernel clock, which is too high and may result in a buffer overflow (PowerWriter® has a built-in Cache of 4K).
- Port : open as per actual: check the chip manual for details.
- Trace Events: Event tracing can be enabled as per actual requirement.
The Trace function supports input and output, and requires a project that proxies the fputc and fgetc interfaces, with the most basic standard input and output overloading code, as shown below:
int fputc(int ch,FILE *f){
    return ITM_SendChar(ch);
}

volatile int32_t ITM_RxBuffer = ITM_RXBUFFER_EMPTY;

int fgetc(FILE * f){
    while(ITM_CheckChar()!=1) __NOP();
    return (ITM_ReceiveChar());
}

int ferror(FILE *f){
    return EOF;
}

void _ttywrch(int c){
    return fputc(c,&__stdout);
}

int __backspace(){
    return 0;
}

void _sys_exit(int code){
    label:
    goto label;
}
After adding the terminal hosting code, you can execute the print log, and input information normally, as shown below:
while(1){
    printf("PowerWriter® Trace (please input number):");
    scanf("%d",&input);
    printf("\r\nYou input number is: %d",input);
}
The MDK Trace menu entry is shown in the figure:

MDK Trace demo effect as shown in the figure, can be used instead of the serial port:

Trace function can not only be used as input/output, but also can be used as virtual oscilloscope, event tracing, etc. For details, please refer to the video tutorials and the related demos, and the following is a list of the more common and advanced applications of Trace function:
Power Writer Trace Logic Analyzer:
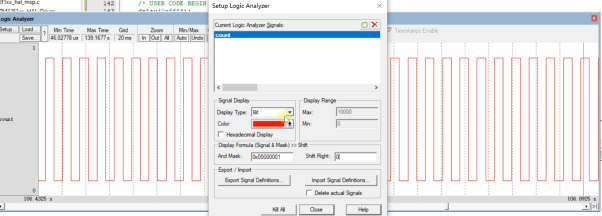
Power Writer Trace system analysis:

Power Writer Trace System Trace Records:
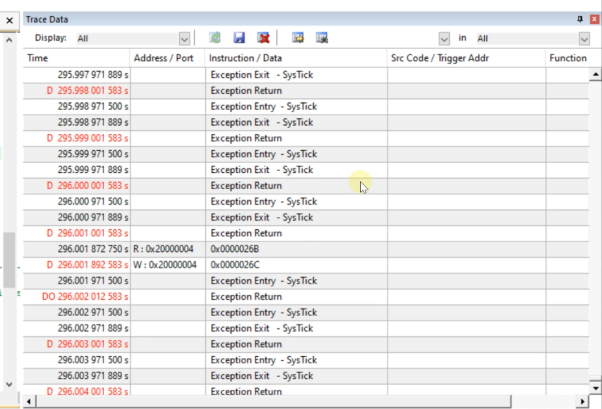
Power Writer Trace System Trace Module Trace:
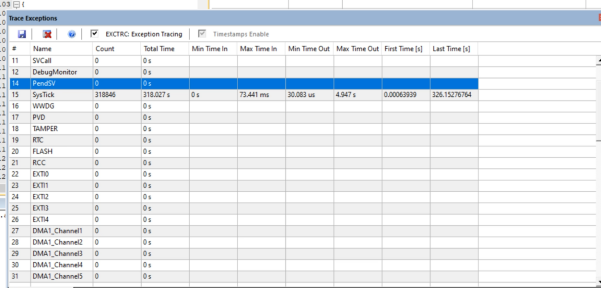
- ITM (SWO ), requires the chip to have an ITM module, the more common CM3, see the listing in Trance Functions.
- Trance function in IAR For ARM is ETM, PowerWriter® interface pin is not enough to support for the time being, please pay attention to the subsequent products.
- ITM supports only MDK use for the time being.
- LINK type products do not have ITM Trace function, please use serial port instead.
3.1.3 PowerWriter® For IAR
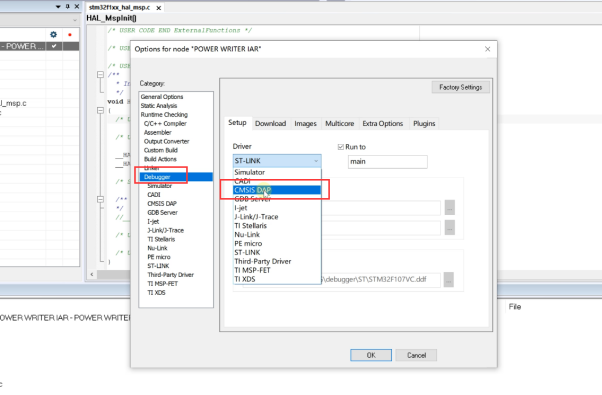
Power Writer's integrated Debugger can be used in the IAR in addition to the MDK. First select the CMSIS-DAP debugger from the Debugger page as shown below:
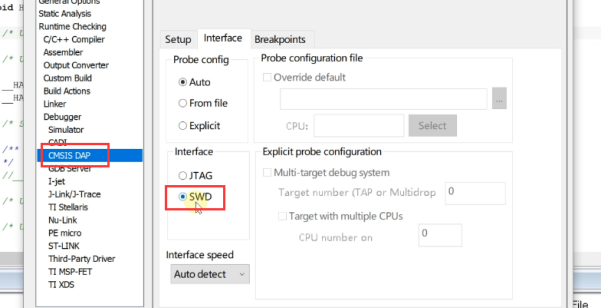
Then select the SWD interface from the Interface interface in the CMSIS DAP as shown:
After the setting is completed, you can enter the debugging page after executing the Start Debugging operation, as shown in the following figure:
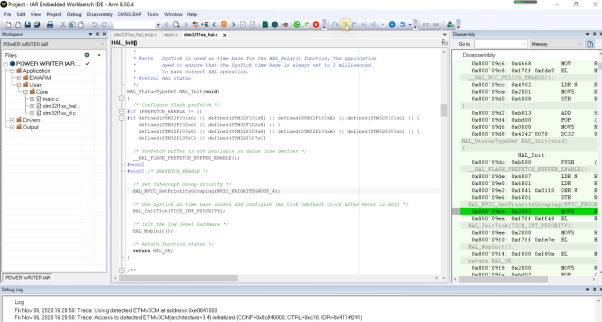
- PowerWriter® For IAR debugging, there is no Trace function, the Trace function in IAR uses ETM, if necessary please use PowerWriter® serial port instead.
- The Debugger and the serial port can be used simultaneously in PowerWriter®, and both are asynchronous.
- PowerWriter® provides debugging protocol for the SWJ protocol, the reason is that the PowerWriter® needs to take into account the Debugger, Writer, as well as production control, serial port functions.
3.1.4 PowerWriter® For Other
Power Writer's debugger is compatible with DAPLINK, other DAPLINK debugger methods, the same can be used on PowerWriter®, such as with OpenOCD + GDB to use, due to the flexibility of this type of configuration method, please refer to the relevant information on their own to configure the corresponding debugging environment, the official site of Openocd: